Improve Your Future Investment Returns By Keeping a Lid on Your Expenses
(Click here to access the article in PDF format.)
By Steve Thorpe
October 1, 2012
Contrary To Popular Belief: Past Performance Truly Does NOT Predict Future Performance
Numerous studies have shown that investors have no reliable way to identify, in advance, which asset classes or active managers will outperform in the future. This phenomenon is persistent across time, market subsectors, and geographic regions. To a large extent, where outperformance exists it is due to random chance -- being in the right place at the right time -- as opposed to skill.
The facts are so well established that mutual fund advertisements are required to include messages such as: “Performance data shown represents past performance and is no guarantee of future results.” [1] I refer the unconvinced reader to excellent books that demonstrate the evidence: Larry Swedroe’s “What Wall Street Doesn’t What You To Know” [2] and Rick Ferri’s “The Power of Passive Investing”. [3]
If you can’t know in advance which asset classes or fund managers will do well, then what can you do to favorably impact your future investment returns? The answer is to expend your energies on things you can control. This article covers one of the most important factors through which an investor can improve their future returns: expenses.
Low Expense Ratios ARE A Useful Predictor Of Future Performance
For decades, the academic evidence has been building that expenses are indeed a useful predictor of future performance within an asset class. For example, here are three results from 1994, 2006, and 2010 respectively (emphasis was added by me):
- “Expenses have a one-for-one negative impact on performance. The more dollars expended on research and trading, the lower the returns.” [4]
- “Expense ratios help you make a better decision. In every single time period and data point tested, low-cost funds beat high-cost funds. Expense ratios are strong predictors of performance. In every asset class over every time period, the cheapest quintile produced higher total returns than the most expensive quintile.” [5]
- “The only attribute that was able to significantly predict future fund performance was the expense ratio. The expense ratio was found to be generally negatively and significantly related to fund performance. Specifically, they found that lower fund expense ratios predict better future fund performance.” [6]
The Wall Street Marketing Machine prefers that investors ignore this evidence, because high-cost funds are a huge source of Wall Street’s revenue. Hence, Wall Street expends considerable resources touting prior outperformance of their fund-du-jour that happened to do well recently. Conveniently (for them) they do their darnedest to deemphasize the truth that prior past performance is no guarantee of future results, and they keep their fingers crossed hoping investors don’t notice.
How significant is the impact of expenses? Let’s work the numbers with a few hypothetical examples.
Example 1: Moderate Allocation
Here are my assumptions for the first example:
- Starting investment of $100,000 into an IRA
- Investment time period is 30 years
- We’ll compare two moderate funds with the same underlying asset class(es), and except for expenses the funds are the same
- Gross annualized expected return of the underlying asset class(es) (before expenses) is 7.2%
- Low-cost investments lose 0.2% to expenses -> net annualized expected return of 7.0%
- High-cost investments lose 1% to expenses -> net annualized expected return of 6.2%
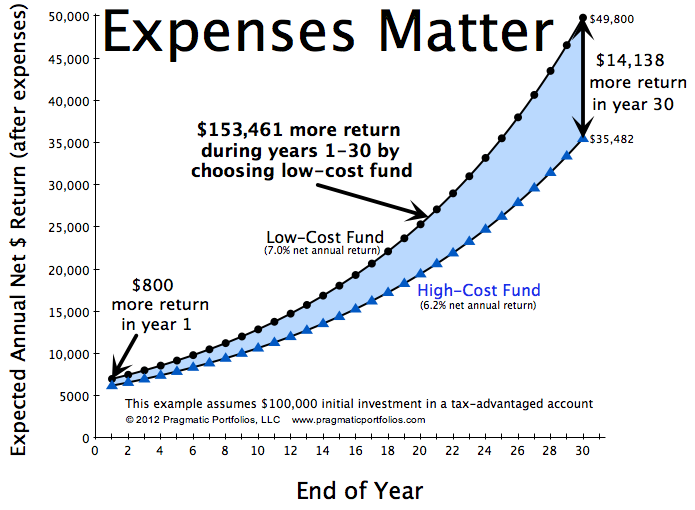
Figure 1: This figure compares the expected returns from the two investments. The blue area represents the $153,461 additional expected return from the low-cost fund, as compared to the high-cost fund.
Results for this example:
- Low-cost investment’s ending value = $761,226 vs.
- High-cost investment’s ending value = $607,765
- Low-cost investment has $153,461 additional growth
- High-cost moderate investment gives up 23% of the total gain that would have been achieved using the low-cost investment ($153,461/$661,226)
The assumptions are for cumulative returns over a 30-year time period, converted to annualized percentages. In reality, you won’t ever find a mutual fund that grows with the same return year after year like in these examples, which are for illustrative purposes only. In the real world, there will always be peaks and valleys along the way. Nonetheless, these examples are perfectly valid to demonstrate the long-term corrosive effects of costs: High-costs are like slow leaks in a pipe – it’s easy to miss them in the short-term but they make a significant negative impact over time.
Example 2: Conservative Allocation
Here is a similar example using the same 30 year time period, except using a conservative asset allocation with only a 4.2% expected gross annualized expected return, with a low-cost fund having a 4.0% net after expenses, and a high-cost fund having a 3.2% net after expenses.
Results for this example:
- Low-cost investment’s ending value = $324,340 vs.
- High-cost investment’s ending value = $257,271
- Low-cost investment has $67,069 additional growth
- High-cost conservative investment gives up 30% of the total gain that would have been achieved using the low-cost investment ($67,069/$224,340)
Example 3: The Plot Sickens With Inflation
Think the above examples were bad? Unfortunately, the end results get even worse when inflation is taken into account. Inflation-adjusted (real) returns are what really matter in the end, because inflation-adjusted dollars represent your actual purchasing power. The previous examples looked at nominal (not inflation-adjusted) returns.
I re-ran the conservative example’s calculations, except I assumed a 2.8% annual inflation rate. So we’ve got a 4.2% expected gross annualized return, with a low-cost fund having a 4.0% net annualized return after expenses, and a high-cost fund having a 3.2% net after expenses. Account for 2.8% for inflation and we’re left with approximately[7] 1.2% expected net real return for the low-cost fund, and 0.4% expected net real return for the high-cost fund.
Results for this example:
- Low-cost investment’s ending value = $141,647 (in today’s $ -- inflation-adjusted) vs.
- High-cost investment’s ending value = $112,356 (inflation-adjusted)
- Low-cost investment has $29,290 additional growth (inflation-adjusted)
- High-cost conservative investment gives up 70% of the total real gain that would have been achieved using the low-cost investment ($29,290 /$41,647)
OMG! 70% of the total inflation-adjusted gain was lost due to the higher expenses!!
Further Evidence that Expenses Matter
William Bernstein published a pair of articles on his web site more than a decade ago that are as true today as when they were written. In 1999 he found that “over time the variation of manager performance, which is random, "washes out," leaving expense as the single most important factor determining return.” [8] In a companion article the following year, Bernstein wrote “There is robust evidence that a dollar of fund expense costs much more than a dollar of fund return” [9] (emphasis added by me).
In 2008, Ed Tower and Wei Zheng studied loads and expenses as markers for moral turpitude. They found that “mutual fund families which charge loads, high expenses to their most favored investors and have high turnover tend to perform badly, even gross of these fees. However, gross of published expenses, managed mutual fund portfolios of those families without loads, with low expenses in their least expensive class, and with low average turnover beat the corresponding indexes.” [10]
Implications on Selecting Investments
The bottom line: expenses have an enormous impact on your investment returns, especially over time and when inflation is taken into account.
Investors paying attention to expenses might want to consider the following rules of thumb to help in choosing investments for their portfolio (I’ll provide more details in a future article):
- Research expense ratios of your investment options
- When selecting investments within each asset class of an investment portfolio….
- (e.g. within domestic stocks, domestic bonds, international stocks, or within finer-grained asset classes such as small cap value, etc. – if used in a portfolio)
- … favor funds with low expense ratios …
- Preferred fund choices within an asset class have lowest expense ratios, and are typically (but not always) index mutual funds or exchange-traded funds (ETFs).
- I wouldn’t quibble about a few hundredths of a percent (also known as “basis points”) difference in expense ratios, in particular where there are features of one fund which you prefer over another. Yet within a given asset class, expense ratio differences of greater than say 0.25% are very significant.
- … and IGNORE past performance
- This does not guarantee improved future performance, but the odds are in your favor, especially over the long-term
Most investors should be able to structure their overall investment portfolio to have no more than 0.25% aggregate annual expense ratios – often significantly lower. The exception is where significant assets are held captive in a retirement plan that is littered with only high-expense options. In that case, an investor may be stuck choosing the “less bad” among bad choices, until such time as it might make sense to roll over the assets into an IRA with more favorable options. Usually rolling over would become possible when leaving the employer.
Another unfavorable scenario is when assets are held with a broker that recommends only investments that have high expense ratios, along with expensive commissions and sales loads. This situation is easily remedied by transferring your assets away from the high-cost full-service broker to a low-cost custodian such as Vanguard, Fidelity, or Schwab. The high-cost broker would protest mightily, however transferring your assets to a low-cost custodian enables you to better fund your own financial goals rather than the broker’s. After all, isn’t that the purpose of your investments?
If You Need Help
If you seek professional investment advice or portfolio management services, I recommend that you work with a Registered Investment Adviser rather than using a broker for these needs. By separating advice and management services from brokerage services, you can receive unbiased advice that is in your best interest and you are much less likely to get the wool pulled over your eyes. Ideally, this can be done using a negotiated flat fee. Furthermore, a Registered Investment Adviser has a fiduciary duty to place its clients’ needs first, which is a more rigorous standard than brokers must adhere to.
Acknowledgements
For their helpful reviews and comments, many thanks to Duke University Professor Ed Tower and to Allan S. Roth, founder of Wealth Logic, LLC.
Disclosure Notice
The data, information, and content in this article are for information, education, and non-commercial purposes only. This information does not involve the rendering of personalized investment advice and is limited to the dissemination of opinions on investing. No reader should construe these opinions as an offer of advisory services.

|
About the Author Steve Thorpe is the founder of Pragmatic Portfolios, LLC, a fee-only Registered Investment Adviser based in Durham, North Carolina that focuses on developing sensible investment plans integrated across all of a client’s investment accounts. He also chairs the Research Triangle Park, NC area chapter of the Bogleheads® [11] investment interest group. |
Footnotes
| [1] |
Seen 8/27/2012 at http://screener.fidelity.com/ftgw/evaluator/mf/goto/search?&assetClass=All |
| [2] |
Larry E. Swedroe’s “What Wall Street Doesn't Want You to Know“, http://www.amazon.com/What-Wall-Street-Doesnt-Want/dp/0312335725 |
| [3] |
Richard A. Ferri’s “The Power of Passive Investing”, http://www.amazon.com/The-Power-Passive-Investing-Wealth/dp/0470592206 |
| [4] |
From Mark M. Carhart’s "On Persistence in Mutual Fund Performance," doctoral dissertation, University of Chicago, December 1994 |
| [5] |
From a Russel Kinnel article “How Expense Ratios and Star Ratings Predict Success” describing a Morningstar, Inc. study, August 9, 2010. http://news.morningstar.com/articlenet/article.aspx?id=347327 (free account signup required) |
| [6] |
Larry Swedroe, at http://seekingalpha.com/article/58102-predicting-emerging-market-fund-pe..., discussing Aron A. Gottesman and Matthew R. Morey’s “Predicting Emerging Market Mutual Fund Performance,” April 11, 2006 |
| [7] |
The detail-oriented and mathematically inclined reader might notice the word approximately. To be precise, the calculation works out to 1.17% and 0.39% expected real returns, respectively. This is derived using the formula Real Rate = ((1 + Nominal rate) / (1 + Inflation rate)) -1. Though it can be fun, know that such precision with estimating the future is essentially meaningless. It is noise compared to the enormous range of possible returns that might happen! |
| [8] |
“Fund Expenses—A Very Slippery Slope” by William Bernstein, 1999. http://www.efficientfrontier.com/ef/799/expenses.htm |
| [9] |
“The Slippery Slope of Fund Expenses, Part II” by William Bernstein, 2000. http://www.efficientfrontier.com/ef/100/exp100.htm |
| [10] |
“Ranking Mutual Fund Families: Minimum Expenses and Maximum Loads as Markers for Moral Turpitude” by Edward Tower and Wei Zheng, International Review of Economics. 55:4. December 2008. pp. 315-350. Draft version also available in PDF form, from http://public.econ.duke.edu/Papers/PDF/Ranking_Mutual_Fund_Families.pdf |
| [11] |
Bogleheads® is a registered service mark of the John C. Bogle Center for Financial Literacy. |